Particle Image Velocimetry (PIV)
The Need for Better Flow Visualisation
Aerodynamic development and research has become increasingly important in Formula One, especially after wind tunnel running hours were restricted to reduce costs and promote closer competition. Exploiting aerodynamic loopholes in the regulations has grown ever more critical. Such gains can only be achieved when engineers work closely together to find every last tenth of a second in a car, and that requires the right equipment – a wind tunnel has been indispensable since the 1980s.
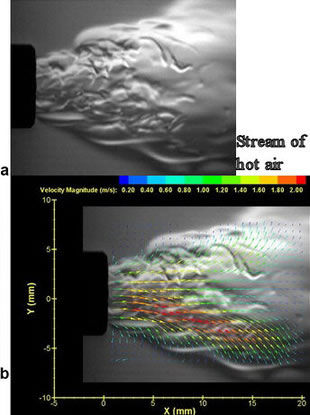
To improve efficiency, F1 teams recognised that it would be extremely helpful to measure and visualise flow fields quickly from wind tunnel tests. The newly developed Particle Image Velocimetry (PIV) system allowed technicians to visualise airflow without introducing a smoke stream into the sensitive air in front of the test subject. While smoke probes were effective, the fundamental problem was how to visualise flow without introducing something new into that flow that could potentially compromise the results. PIV provided an excellent solution.
How PIV Works
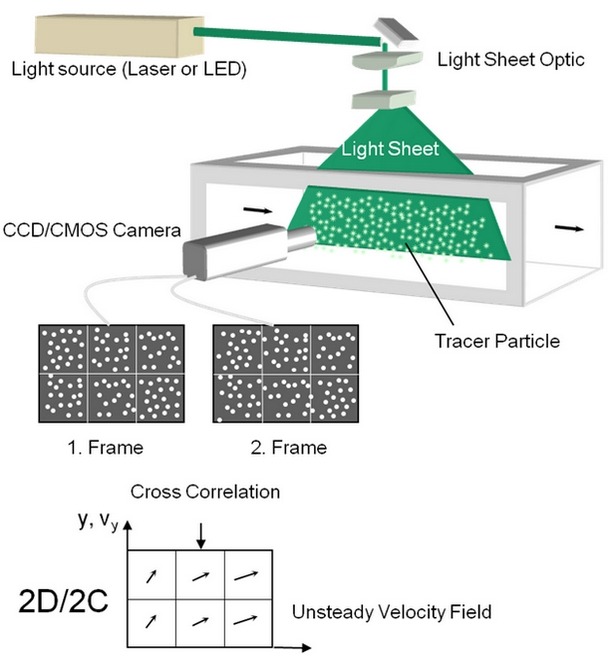
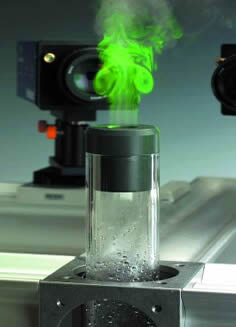
It takes approximately one hour of start-up time to bring a wind tunnel from standstill to a fully active PIV system. The process involves slowly filling the wind tunnel with a fog or mist, dispersed by a fog generator. The most commonly used chemical for fog generation is Di-Ethyl-Hexyl-Sebacat (DEHS), chosen because it is non-toxic, liquid at room temperature, and has nearly the same density as air. When air flows through the tunnel, the small DEHS particles simply float, making PIV as non-intrusive as possible. The fog generator is located on the opposite side of the tunnel or inside the honeycomb panels. Uniform distribution of fog particles is critically important. Air speed is slowly increased to the full or required speed, during which time final checks are performed to ensure accurate measurements.
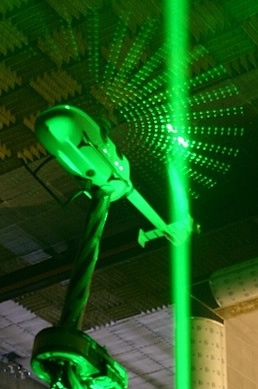
Once the DEHS particles are evenly distributed in the wind tunnel, the camera is positioned at a 90-degree angle to the airflow field being tested. Engineers illuminate the target area with a high-powered laser, creating a two-dimensional plane. Simultaneously, a series of paired photographs are taken at extremely rapid intervals – two images captured 10-20 microseconds apart. With this type of ultra-slow-motion digital imaging, engineers can easily view and measure the direction and rate of the flow field. PIV also does not prevent wind tunnel engineers from running other tests concurrently.
Model Preparation and Calibration
Before a PIV test can run, special attention is required to prepare the model. Surfaces hit by the laser are specially treated to reduce reflections. The camera positions must be calibrated first, and then the laser is correctly positioned based on those camera positions. For testing the same subject (such as a Formula 1 car), cameras are permanently installed in the wind tunnel to get the laser sheet in the correct position. All the laser optics are mounted on traversing units, enabling the laser sheet to be moved to the required measurement positions. This makes the set-up quick and repeatable.
During the time the laser is active, the lights inside the tunnel are switched off while an infrared
camera allows the engineers to monitor the model during testing. When everything is deemed ready, the wind tunnel speeds up to the required testing speed, the laser is fired up, and images are recorded. At this stage, it is also straightforward to measure flow characteristics in different configurations. Without repeating the previous preparation steps, engineers can adjust the ride height of the car, change the wind tunnel speed, or modify the front wing flap angle from the control room, thanks to the model being rigidly attached to the movable wind tunnel pylon.
When the test is complete, the DEHS gas evaporates completely after several hours without leaving any trace on the model or the wind tunnel internals. Regular wind tunnel testing can therefore continue without requiring any cleanup.
Data Analysis and CFD Correlation
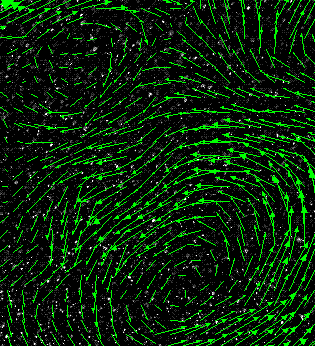
After gathering raw data from the PIV measurements, engineers can plot the velocity magnitude and vorticity of a given area, then compare the datasets to determine whether their CFD methods fall within acceptable accuracy ranges. The results of the CFD computations are imported into software to create the same type of visualisation as the PIV data. Engineers can then alter the CFD methodology based on these observations, import updated results, and compare them with the PIV data to evaluate their progress. This process can be repeated until an optimal design is reached. Whenever necessary, engineers can tweak the CFD process to bring it closer to the wind tunnel results.
In its F1 application, PIV proved vital for improving the correlation between modelled airflow simulation through CFD and real-world testing in the wind tunnel or on track. It allows engineers to rely on CFD results to validate or refine the design of a component.