Telemetry
What Telemetry Does
A host of electronic devices, including the ECU (Engine Control Unit), transmit specific data – such as measurements and status information – to a remote site. In the case of F1, that remote site is the pit wall and pit garage. The system electronically records performance of the engine, status of the suspension, gearbox data, fuel status, all temperature readings including tire temperature, g-forces, and actuation of controls by the driver. The data is then used as a foundation for determining car setup and diagnosing problems.
Evolution of F1 Telemetry
The use of telemetry started in the late 1980s when teams sent data only in bursts as the car passed close to the pits. Technology moved on to continuous high-rate data in the early 1990s, but on tracks like Monza, Spa, or Monaco, where cars pass through trees or between buildings, there were sections of the track where teams lost real-time data coverage.
Into the 2000s, teams fixed that limitation by retransmitting data that was not received as soon as the car returned to areas of coverage. By the time the car passed the garage, all the data for that lap had been seen.
In 2002, two-way telemetry was permitted so engineers could change settings on the cars from the pits. This is no longer allowed, but much was learned during that period.
Nowadays, multiple antennae are placed around the circuit. McLaren Electronic Systems, the supplier of the F1 Electronic Control Unit, places antennae that are available for all teams to use. As the cars travel around the track, they transition between antennae – similar to how a mobile phone network works. This provides nearly 100% time coverage and the high bandwidth that teams demand, even on the most difficult circuits.
Differential Tuning
Working with telemetry data, a large part of the time is spent working on the differential, the most tunable part of the car. The differential, which allows the two rear wheels to rotate at different speeds, can be adjusted for corner entry, mid-corner, and corner exit. It plays a significant role in cornering stability and, done well, can contribute substantially to lap time.
How Telemetry Works
Under FIA rules, it is not possible to send electronic information to the cars. The system is therefore one-way, sending data from the cars to the pit. Engineers can analyse the data in real time and see if something is wrong, or advise the driver on how to improve driving technique or car settings. Many teams also send data to their headquarters, where a dedicated team analyses it in real time.
Sensors and Data Volume
Each car has from 150 to 300 sensors. The exact number varies from track to track as sensors are added and removed. From practice sessions to the official race, some sensors may be removed if found unnecessary for a particular track, saving weight.
Data is sent from the car to the garages using 1,000 to 2,000 telemetry channels, transmitted wirelessly using the 1.5 GHz frequency or a frequency allowed by local authorities. These channels are encrypted. The typical delay between data collection and reception at the garages is 2 milliseconds. For each race, the amount of collected data is in the range of 1.5 billion samples. Including practice days, the total is approximately 5 billion samples. During a 90-minute session, the team collects between 5 and 6 gigabytes of raw compressed data from one car.
| 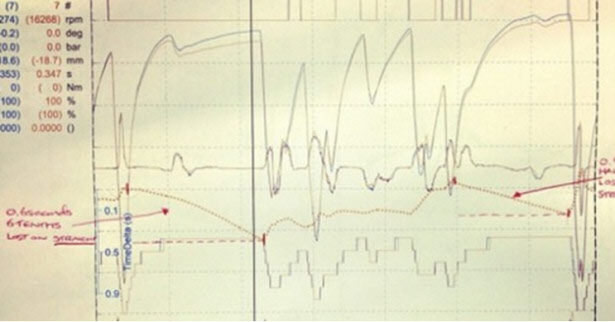 |
Telemetry sheet Lewis Hamilton curiously tweeted on Sunday morning before Belgian GP race at Spa 2012, not only contained traces of the two drivers’ laps superimposed, showing where Hamilton was losing time to Button, but also information about the car’s settings, including sensitive data such as its car settings and ride height’. Its shows him losing 0.5s in both the high speed sectors 1&2 but what it does not show is that the idea with running a higher downforce wing is that you make up a second in Sector 2. So the lap times end up more or less the same.“Jenson has the new rear wing on, I have the old. We voted to change, didn’t work out. I lose 0.4 tenths (of a second) just on the straight” - was the body of the tweet. Button got it right. Hamilton did not. The image was deleted not long after with McLaren team principal Martin Whitmarsh confirming that they asked him to take it down because it contain confidential data. “He made an error of judgement and we asked him to take that one down, and he did.” Asked as to whether any action would be taking ahead Hamilton, Whitmarsh said: “No. But it would be interesting to see how other team principals would deal with it.” As for how at least one team boss would reaction, Red Bull’s Christian Horner said he would deem it to have been a “a breach of confidentiality.” He added: “I haven’t seen the tweet in detail. But from what I understand it was car data, and if it was car data then I’m sure every engineer in the pit lane is having a very close look at it.” Click on picture to get bigger version. |
Data Transmission and Storage
Since data is compressed, actual transfer rates are smaller than the raw data volume would suggest. Each car is independent, so since each team has two cars, the total collected data is actually twice as high.
The transmitter is placed in the sidepod and a cable runs to an antenna on the nose of the car. Each car also has an on-board storage system that buffers the most recent data, so if transmission fails, the car keeps retrying until the transmission is completed. If the car enters a tunnel (as at Monaco) or any blind spot, the car continues collecting data and storing it on its on-board memory. As soon as communication is restored, all data collected during the outage is sent at once.
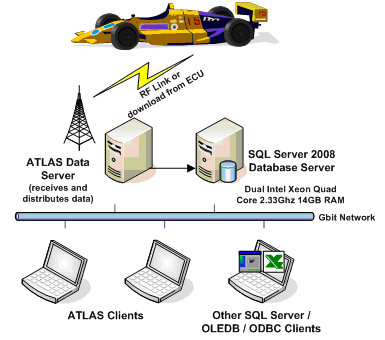
The data is then decoded and converted into a signal that can be understood by a PC. It goes through a data server system called ATLAS (Advanced Telemetry Linked Acquisition System, developed by McLaren Electronic Systems – MES) which displays the telemetry channels for the engineers. This is the suite which displays all the characteristic traces on the screen.
|
ATLAS has become the standard data acquisition package in the F1 paddock due to the use of an FIA spec MES engine control unit on all cars. The entire data acquisition package consists of on-board car data logging electronics and transmitter radio, transmitting data via radio frequency to telemetry receivers in the garages. The receivers decode the data and operate as central servers of the decoded data to distribute it over a local ethernet based network. Any appropriately configured PC computer, running ATLAS software, can simply connect to the network and receive data from the telemetry receiver server. The simple ethernet architecture of the data distribution network also lends itself to an ease of sending the live telemetry back to the factory to engineers and strategists. Data is referred to in two forms; “Telemetry” is live data, and “Historic” is logged data or also backfilled telemetry. The hardware and infrastructure of the system is beyond the scope of this discussion, but is fundamental to understanding how an engineer would receive the data and with what tools he or she would interact with it. |
In summary, many computers with several LCD displays plotting charts and showing data, with many engineers analysing the information.
AMD and Ferrari
Ferrari F1 cars carry an AMD logo on the tail. AMD provides the technology infrastructure for the car’s telemetry system, which collects data in real time and sends it to the Ferrari team during races. This allows real-time monitoring for problems and driver coaching. The collected data is also used for post-race analysis.
Custom Radio Systems
In Formula 1, the radio environment during race weekends and test sessions required the development of custom radio systems. Systems such as GSM, DECT, and Bluetooth were never designed to support the data rates required or operate in this radio environment.
The starting point in designing a custom communications system is to address the first key question: what are the requirements of the system? Considerations of a wide variety of parameters – including data rates, available frequencies, acceptable latency, quality of service, countries of operation, hardware size, cost, power consumption, and more – are all required. Radio frequency spectrum is a rare resource managed by international and national regulation.
The selection of a suitable frequency band is a complex issue, typically involving limitations on maximum output power, acceptable modulation schemes, installation locations, and the applications served. The regulations vary from country to country, although the process within the EU is now quite well harmonised.
All data is sent in encrypted form to prevent data leakage to other teams.
Reading Telemetry Data
Telemetry reading for Silverstone
In this telemetry printout, the traces represent (from top to bottom): a map of the Silverstone circuit, gears used, engine revs, and g-force as small dots.
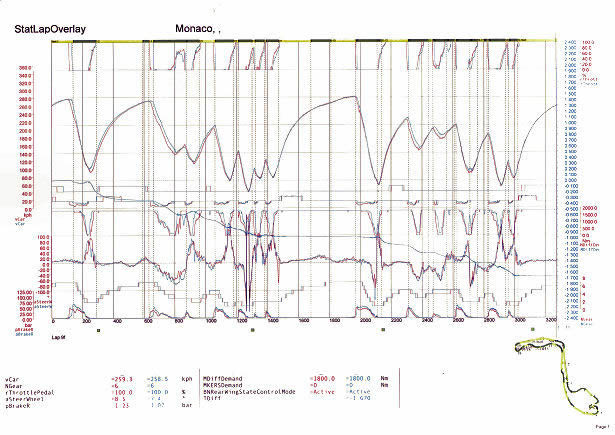
The ATLAS system can be loosely compared to Microsoft Excel in reference to its working surfaces. In Excel, most people are familiar with the “workbook” containing multiple “worksheets” with any number of user-created charts and information. ATLAS organisation is similar: an ATLAS “workbook” contains multiple “pages” organised in a similar tabular graphic user interface. Each page contains user-created “displays” on which to analyse data. The printed sample is data of two drivers “overlaid” on one single ATLAS workbook, in the same manner that an individual chart can be printed from Excel. In this way, a driver can compare each lap and learn and improve driving style, or compare laps with a team-mate.
|
This particular type of display is referred to as a “waveform.” A waveform display presents data relative to time or distance as the domain of the plot. Each car’s respective data is identified by color. Here, blue colored data traces from one car are compared to red colored data traces from another car. Each individually named parameter represents the calibrated output of a unique and individual on-board sensor. Additionally, a parameter may represent a “function parameter”, a mathematical output based upon sensor outputs input into mathematical calculations.A track map of Monaco is located in the lower right corner of the display. In addition, we see that corners are identified as green and straights are yellow. The ATLAS software automatically generates the map based upon lateral acceleration and track distance logged data. The green corners are calculated and determined against thresholds of lateral acceleration. |
Plextek Telemetry Systems
One of the best-known suppliers of telemetry equipment is Plextek. Plextek has supplied Sauber, Williams, Red Bull, STR, and Ferrari. The company was approached in 1998 by Pi Group, at the time a sponsor and supplier of electronic equipment for Williams and Jaguar F1 Racing, to develop a new telemetry system for Formula One motor racing.
First tests of the new Plextek system were undertaken at Silverstone, Hockenheim, Nurburgring, and Barcelona circuits to produce coverage estimates showing the likely performance of the system. This approach allowed an early check on whether the initial objectives were likely to be achieved prior to the final design of the equipment.
The system developed by Plextek and Pi Group first saw success at the San Marino Grand Prix at Imola on Easter Sunday 2001, when the Williams-BMW team notched up the first victory of their two-year partnership.
In the gap between the 2001 and 2002 seasons, Pi returned to Plextek for a software upgrade programme. These improvements allowed a fully acknowledged handshake protocol. The new software also provided a data downlink channel to the car, which was illegal under the 2001 FIA rules but was allowed from 2002. The upgraded telemetry system was installed on four Formula One team cars, including Williams-BMW, Jaguar, and Arrows.