Aero Mapping
The Importance of Aerodynamic Development
Aerodynamic development can make a car progressively faster by adding downforce, as long as the additional drag associated with it does not have a detrimental effect on straight-line speed. The most important element in this regard is the floor and diffuser, as they develop the most efficient downforce with a small penalty in drag. However, the front and rear wings are the main contributor and the key to tuning and balancing the car correctly. The floor and diffuser cannot be changed easily on the track. In other areas, such as the sidepods and front chassis, designers focus more on limiting negative effects, as these surfaces tend to create lift rather than downforce because of how they must be profiled. The basic principle is that speed and pressure are inversely connected: the faster the air moves, the lower its pressure. For more on how wings work, see the article on the Bernoulli equation. In Formula 1, curving the surfaces of a wing so that air must move faster along the lower surface than along the upper surface creates a net downward force, which pushes the tyres into the track to create more grip.
All this downforce comes with the negative effect of increased drag, which slows the car. The downforce/drag relationship across different wing configurations – and understanding these relationships for every single configuration – is very important for making fast and precise decisions on the track. Guessing on race day is not an option.
Wing Adjustment and Aero Set-Up
Looking at the aero set-up, the driver will want the car balanced to a certain point. The driver may prefer the centre of gravity in a certain position, which will generally differ from the team-mate’s preference. The two aerodynamic devices that can be changed on the car are the front and rear wings; the rest of the aero set-up is fixed and only modifiable in the long term through wind tunnel testing. The front and rear wings provide massive downforce at each end of the car, and each one can be altered to vary the amount of force it produces.
Each wing has two defining measurements: the chord (the distance between the leading and trailing edges) and the span (the width of the wing on the car), with the cross section defining the final shape. After the wing is designed, the angle of attack determines how much force it produces. At zero angle of attack, the wing still produces some downforce because of its shape (the distance underneath is longer than over the top). Increasing the angle produces more downforce, up to a certain point. Beyond that point, the air begins to separate from the surface (stall), and the downforce produced drops drastically. By varying the angle of attack up to that point, the engineer can fine-tune the car.
The front and rear wings are generally made up of two parts: the mainplane and the flaps. The mainplane creates the bulk of the downforce and sits at a fixed angle of attack. Fine-tuning comes from the flaps. Varying amounts of downforce can be obtained by changing the flap angle, and it is a half-degree change of angle on the flap that is used for fine adjustment. The flap angle can be changed simply with a screwdriver-type device, without losing time during a pit stop. Similarly, rear wing tuning through flap angle changes can add or reduce downforce at the rear.
Creating the Aero Map
Although a racing car’s basic shape and general aerodynamic performance are first sketched out on the designer’s computer, this is only the beginning. During development, every team spends many hours in the wind tunnel using a model of the car with many different components, testing hundreds of different configurations. The team will run hundreds of aerodynamic trims and examine lift/drag trade-offs, predict ride heights, and alter the suspension set-up so that the car’s aerodynamics are optimised at different trims. This process aims to gain a better understanding of what affects the car’s performance and why, at any tested configuration. The results are carefully “mapped.”
The same procedure is performed for each different wing design and car configuration. Regression models are created for each response to provide aerodynamic prediction and optimisation capabilities. The aero map shows how the wing elements and ride heights on a racing car perform in different settings in terms of lift and drag. Everything is carefully recorded and data tables are created. Each wing or configuration has its own aero map.
A plot of drag vs. downforce of an entire map |
Using the Aero Map at the Circuit
The aero map is taken to the circuit by the race engineer. Race engineers can then use these maps to help choose the best settings for a particular wing on a particular circuit. The map shows the most efficient way of obtaining a certain level of downforce or performance using the available wing elements. If the driver wants more rear downforce, it shows the engineer how best to achieve it, and then what front wing flap angle is required to balance the change. The map is used to determine the effect of every single change of front ride height, car rake, front wing angle, rear wing angle, Gurney flap height, and yaw angle on front downforce, rear downforce, drag, and lift-to-drag ratio. An aero map is essentially aerodynamic data – the signature of a specific car configuration – expressed as numbers in a computer.
Track Correlation
On the track, aero mapping data is used to correlate in real time what the wind tunnel figures predict about aerodynamic elements. The pace of development in Formula 1 is so rapid that a car seldom goes to a race without some aerodynamic updates. With limitations on testing and new aerodynamic regulations, teams work hard to make the most of track time before the season starts.
During track aero mapping, teams use multiple sensors to measure the downforce generated at various speeds, laser ride height sensors, and suspension force transducers. A less technical solution is the use of flow-vis paint. This is a common practice in recent years, used to confirm wind tunnel readouts and maps. The aero maps
created on track are vital in helping race engineers identify any wind tunnel data that does not correspond with real-life results, and thus find the perfect set-up for race day.
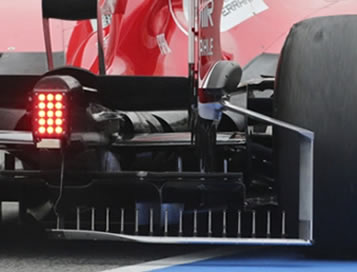
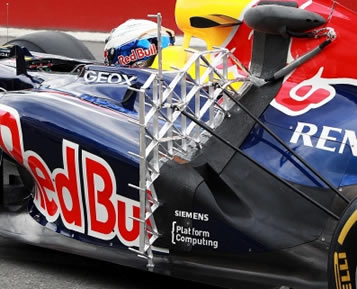
On-Track Sensor Arrays
Aero mapping can also be done directly on the track using various sensors. The idea is straightforward: through controlled set-up changes, teams seek to understand aerodynamic behaviour in different airflows. This data is invaluable when planning to use different wings, ride height parameters, or when measuring flow around different parts of the car. Lasers are used to constantly measure ride height at each corner of the car.
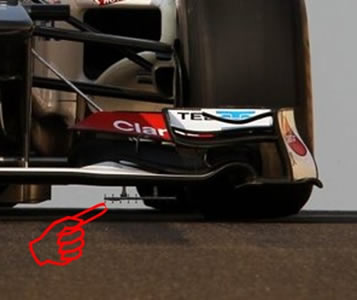
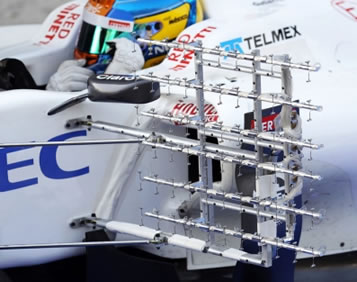
The aero rake (aero rig, an array of sensors) can be used for measuring air speed, flow angle, pressure (Pitot-Static probe), and even temperature at precise and specific positions. Multiple rows of rakes are used, securely mounted on different parts of the car. Sensors on these aero rakes collect data on body wake, creating effective and data-rich information sheets. Aero rakes are commonly seen in front of or behind the tyres, on top of or behind the sidepods, behind the diffuser, or behind the rear wing. These rigs are custom-shaped, expensive sensor grids. Force India, Red Bull, and McLaren have all spent time using complex motorised and adjustable air-speed Kiel Probe sensor arrays to measure the pressure field behind the front tyre. The height of the array can be changed
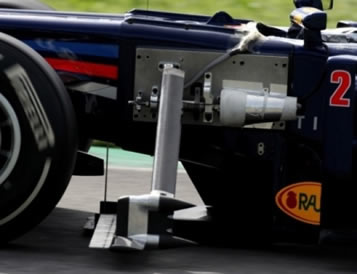
during a run in a precise manner. This test equipment traverses vertically during a run to capture the complete wake from the front tyre for correlation with wind tunnel and CFD data – a crucial step in ensuring that the development process is working efficiently. The photograph shows the array in its low position.
The driver then runs at a fixed speed along the straight. Maintaining a consistent speed creates an aero map of flow across the body and ensures the data is consistent (or not) with data from the wind tunnel and CFD. The data from these tests is used to direct the team in deciding how the wings should perform.
Use in Simulation
Aerodynamic mapping can also serve as a mathematical model for numerical lap simulations and aero component evaluation. Teams can import an aero map of a component into the simulator and evaluate its effect on the balance of the car. Because it is just a set of numbers, the aero map can be loaded into a simulator for testing and assessing how a component feels for the driver.
Engineers can create an entirely theoretical wing aero map with nothing physically built. Based on those numbers, they can conduct test runs on the simulator, assess the theoretical wing, and potentially never manufacture it. In the same manner, multiple parameters can be displayed, derived from the base suspension, chassis, tyres, aerodynamics, and other systems. These results are also available in table format as data values, allowing export to chart-drawing software.